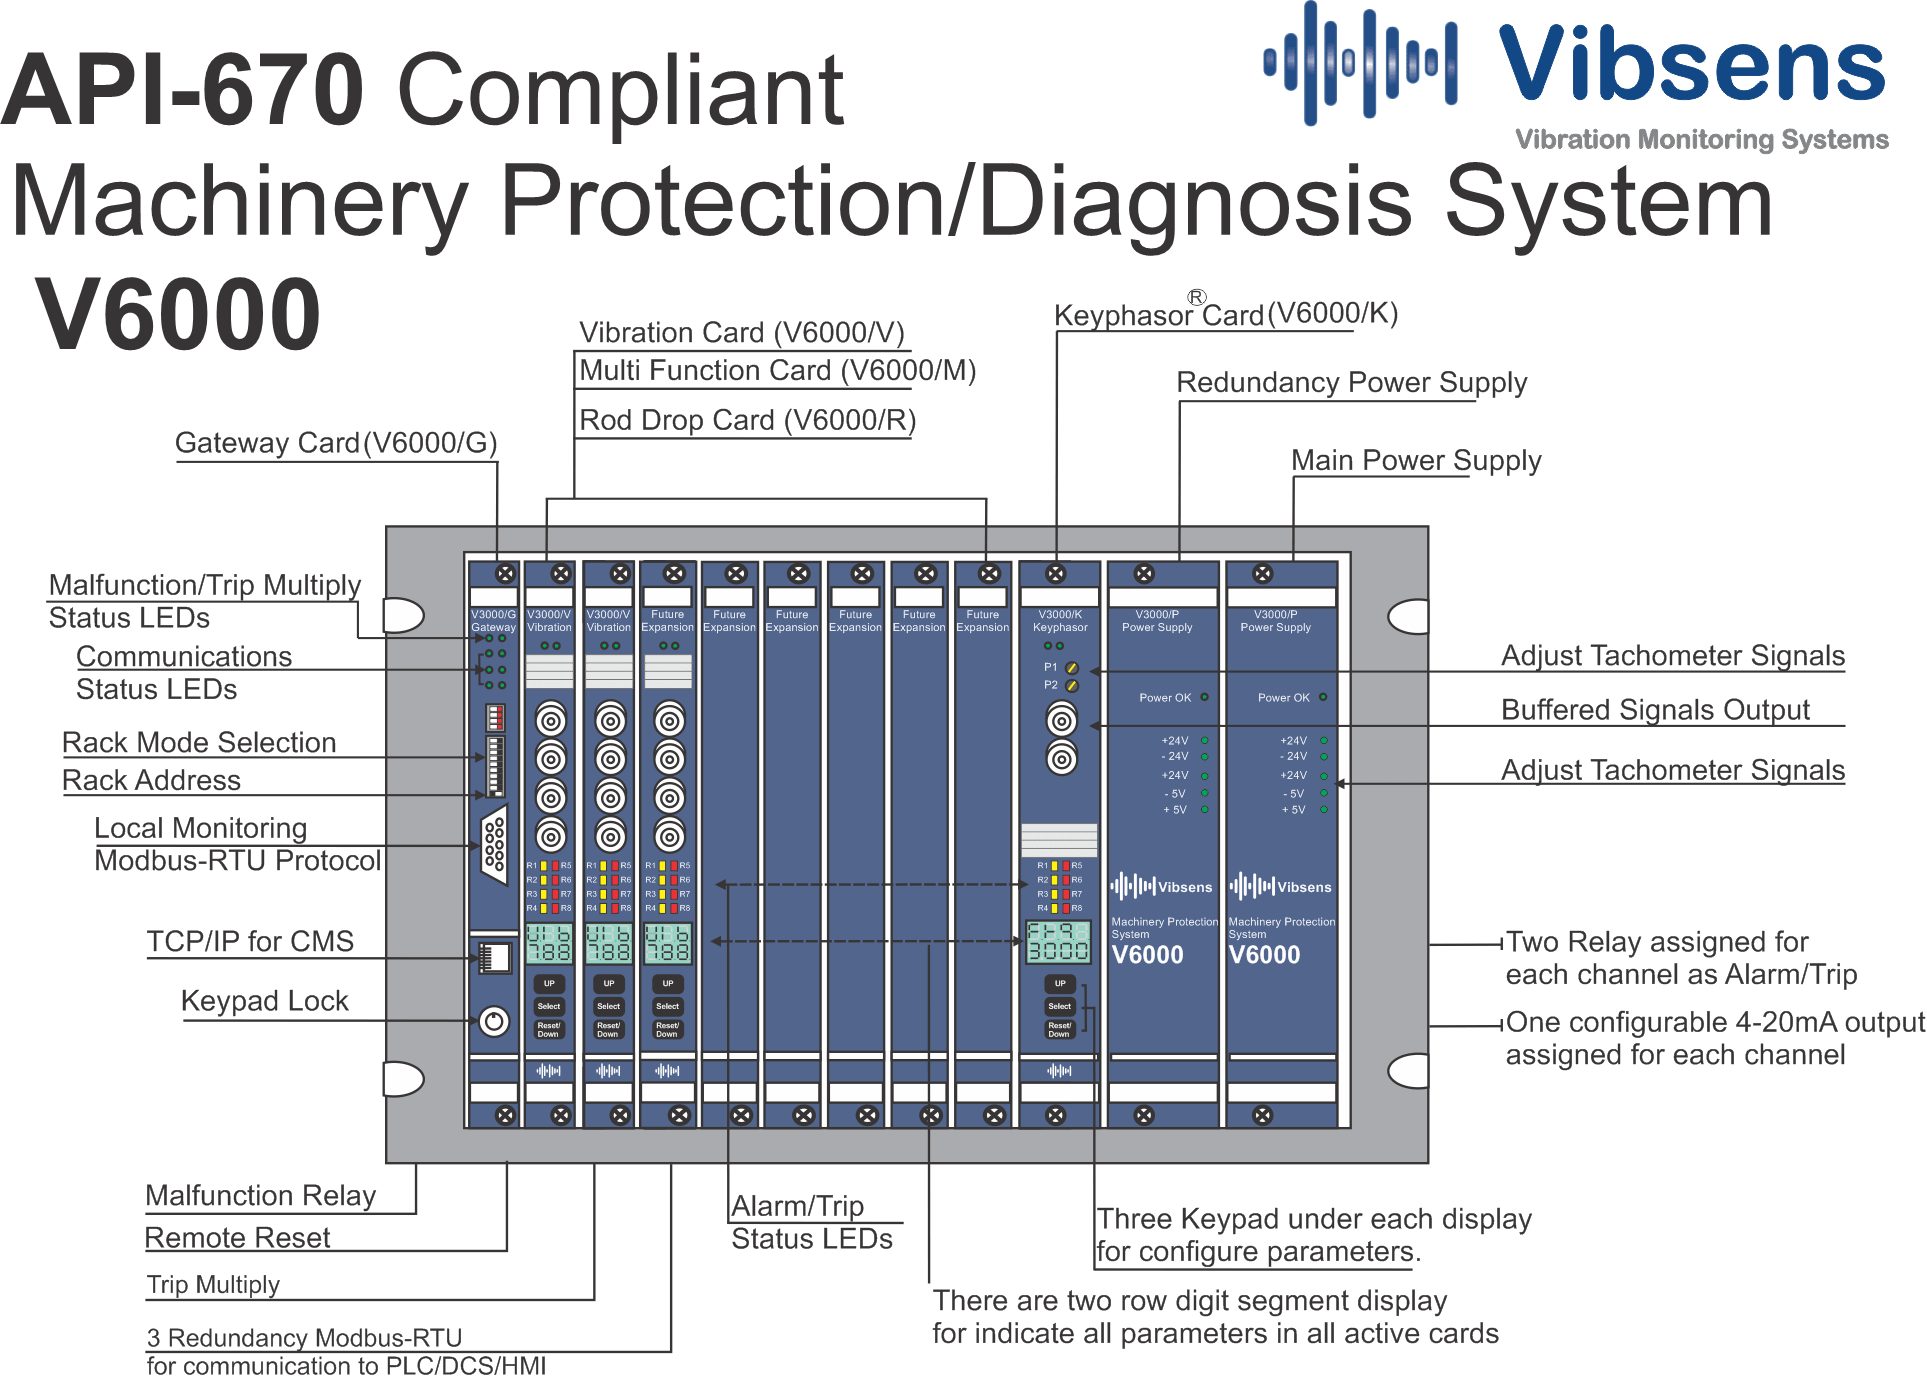
Machinery Protection / Diagnosis System
V6000 is API670 Compliant.
API670 Requirements
API670-5th edition Requirements for machinery protection system
4.9.3 RFI Immunity
The satisfactory operation of electronic instrumentation in the presence of radio frequency interference requires that both the level and the form of the interference, as well as the required degree of immunity to it, be clearly defined by the owner (one company may not allow the use of radios in a control room whereas another may allow their use behind instrument panels in the control room while the enclosures are open). Once the requirement for immunity to radio frequency interference is defined, the details of electronic design and hardware installation can be established (see Note). Unless otherwise specified, MPS’s shall comply with the electromagnetic radiation immunity requirements of EN 61000-6-2 and shall use metallic conduit or armored cable.
4.9.4 Conformal Coating
If specified, printed circuit boards (PCBs) shall have conformal coating to provide protection from moisture, fungus, and corrosion. NOTE it may not be possible or desirable to conformal coat PCBs in all monitor applications. Examples include complex circuit boards containing heat sinks, DIP switches, or complex interconnections. In general, field-mounted systems in humid or corrosive environments justify conformal coating. Contact MPS vendor for specific details and capabilities.
4.10 Power Supplies
All machinery protection monitor systems shall be capable of meeting the accuracy requirements specified in Table 1 with input voltage to the power supply of 90 Vac rms to 132 Vac rms or 180 Vac rms to 264 Vac rms, switch selectable, with a line frequency of 48 Hz to 62 Hz. If specified, the following power supply options may be used:
- a) 19 Vdc to 32 Vdc,
- b) 14 Vdc to 70 Vdc,
- c) 90 Vdc to 140 Vdc.
4.10.6 Power Supply Immunity
All power supplies shall be immune to an instantaneous transient line input voltage equal to twice the normal rated peak input voltage for a period of 5 ìs.
4.10.9 Power Supply Transformer Windings
As a minimum, the input power supply transformer for all instruments shall have separate windings with grounded laminations or shall be shielded to eliminate the possibility of coupling high voltage to the transformer secondary. In case of an insulation fault, the input voltage shall be shorted to ground.
4.10.10 Redundant Power Supplies
If specified, the machinery protection monitor system shall be fitted with a redundant power supply. Each power supply shall:
- a) accept the same input voltages or different input voltages as the other power supply (for input voltage options, see 4.10.1 and 4.10.2);
- b) independently supply power for the entire machinery protection monitor system such that a failure in one supply and its associated power distribution busses shall not affect the other;
- c) allow removal or insertion with power applied without affecting the operation or integrity of the protection system;
- d) provide automatic switchover from one power supply to the other without affecting the operation or the integrity of the protection system.
4.11.3.a Front panel Indicator Test
At minimum, each machinery protection monitor system shall be provided with the following features and functions:
- a) a method of energizing all indicators for test purposes;
- b) an internal time clock with provisions for remotely setting the time and date through the digital communication port of 4.13.1;
- c) all modules capable of removal and insertion while the system is under power without affecting the operation of, or causing damage to, other unrelated modules.
4.11.4.a Channel Isolation
- a) Isolation to prevent a failure in one transducer from affecting any other channel.
4.11.4.b OK Checks and Indicators
- b) A means of indicating internal circuit faults, including transducer system failure, with externally visible circuit fault indication for each individual channel. A no-fault condition shall be positively indicated (e.g. lighted). A common circuit fault relay shall be provided for each monitor system.
4.11.4.d Buffered outputs
- d) Individual unfiltered buffered output connections for all system transducers (except temperature) via front-panel bayonet nut connector (BNC) connectors and rear panel connections. If specified, the monitor system may employ connectors other than BNC or locations other than the front panel.
4.11.4.e 4-20mA Outputs
- e) If specified, a 4 mA to 20 mA DC analog output shall be provided for each measured variable used for machine protection in addition to the digital output of 4.13.1.
4.11.4.f CMS Interface
- f) If specified, a digital communications port shall be supplied for transmitting data between the MPS and compatible condition monitoring software. The protocol used shall be mutually agreed upon between vendor and purchaser.
4.11.5.d Alarm Response Time
- d) With exception of electronic over speed detection (see Note), the time required to detect and initiate an alarm (alert) or a shutdown (danger) shall not exceed 100 ms. Relay actuation and the monitor system’s annunciation of the condition shall be fixed by the time delay specified in 7.1.5 a).
4.12.3 Relays
Unless otherwise specified, output relays shall be the epoxy-sealed electromechanical type.
4.12.9 Relay Contact Ratings
Contacts shall be rated at a resistive load of 2 amperes at 120 Vac, or 1 ampere at 240 Vac, or 2 amperes at 28 Vdc for a minimum of 10,000 operations. When inductive loads are connected, arc suppression shall be supplied at the load. If specified, contacts rated at a resistive load of 5 amperes at 120 Vac shall be provided.
4.12.11. c System Shutdown Disabled Annunciator
A disarmed condition shall be locally annunciated at the monitor subsystem via positive indication (e.g. lighted when disarmed).
4.12.11.f System Shutdown Disabled Annunciator Contacts
If specified, two sets of isolated external annunciator contacts shall be provided.
4.13.1 Digital Communication Link Protocols
A digital output representative of each measured variable shall be provided at a communications port. A short circuit of this output shall not affect the MPS, and the output shall follow the measured variable and remain at full scale as long as the measured variable is at or above full scale. Unless otherwise specified, the protocol utilized for this standard digital output shall be Modbus.
4.11.5.g Reset
Local and remote access for resetting latched alarm (alert) and shutdown (danger) conditions. For rack based systems, front-panel switch and rear-panel connections shall be supplied.
4.11.5.h First-Out Indication
A means to identify the first-out alarm (alert) and the first-out shutdown (danger).
5.3 Temperature Sensors
5.3.1.1 The standard temperature sensor shall be a 100-ohm, platinum, three-lead resistance temperature detector (RTD).
5.3.1.2 Unless otherwise specified, the standard RTD shall have a temperature coefficient of 0.00385 ohm/ohm/°C.
5.3.1.3 If specified, Type J, Type K, or Type N thermocouples shall be supplied in accordance with ANSI MC96.1 (IEC 584-1). NOTE Type N thermocouples would be typically used for higher temperature applications.
5.3.1.4 Temperature sensors for electrically insulated bearings shall maintain the integrity of the bearing insulation.
7.1.2 Contiguous Enclosure
Unless otherwise specified, signal processing/alarm/integrity comparison, display/indication, and all other features and functions specified in Section 4 shall be contained in one contiguous enclosure (rack) (see Figure 1). With purchaser approval, a system not enclosed in one contiguous enclosure (rack) and meeting all other requirements and functionality of a default system may be supplied.
7.1.3.a Affected Channels Under Single Failure
An installation design ensuring that a single circuit failure (power source and monitor system power supply excepted) shall not affect more than two channels (regardless of channels available on the monitor module) of radial shaft vibration, axial position, casing vibration, speed indicating tachometer, or six channels of temperature or rod drop on a single machine case.
7.1.3.b Display Resolution
All radial shaft vibration, axial position, rod drop, and casing vibration channels, associated outputs, and displays shall have a minimum resolution of 2 % of full scale. Temperature channels, associated outputs, and displays shall have 1° resolution independent of engineering units. Tachometer and electronic ODS channels, associated outputs, and displays shall have a resolution of 1 rpm.
7.1.3.c Controlled Access Protection
Electrical or mechanical adjustments for zeroes, gains, and alarm (alert) and shutdown (danger) set points that are field changeable and protected through controlled access. The means for adjustment, including connection(s) for a portable configuration device, shall be accessible from the front of the monitor system. The monitor system alarm and shutdown functions shall be manually or automatically bypassed in accordance with 4.12.11 during adjustment.
7.1.3.d Phase Reference Transducers
It is permissible to install the modules to monitor more than one machine train in the same monitor system rack (chassis). However, each machine train shall have dedicated monitor modules. When multiple machine trains are monitored using a single rack, the monitoring system shall support the capability of accommodating multiple phase reference transducer inputs from each of these machine trains/cases.
7.1.4 Gain Adjustment
A monitor system shall include the following signal processing functions and outputs:
- a) gain adjustment for each radial shaft vibration and axial position channel,
- b) default gain adjustment shall be factory preset to 7.87 mV/ìm (200 mV/mil).
7.1.5.b Per-Channel Alarm Annunciators
- b) Alarm (alert) indication for each channel or axial position channel pair.
7.3.2 Number of Relays
As a minimum, one pair of relays—alarm (alert) and shutdown (danger)—shall be provided for each of the
following monitored variable types per machine train:
- a) axial position,
- b) radial shaft vibration,
- c) casing vibration,
- d) bearing temperature,
- e) piston rod drop.
7.4.4.1 Radial Shaft Vibration Monitoring
The full-scale range for monitoring radial shaft vibration shall be from 0 to 125 ìm (0 to 5 mil) true peak to peak displacement. Peak-to-peak values factored from any other intermediate value or calculated measurement, other than the transducer or signal interface is not acceptable. If specified, the standard optional full-scale range shall be from 0 to 250 ìm (0 to 10 mil) true peak-to-peak displacement.
7.4.4.6 Optional Configurations for Casing Vibration Channels
If specified, a casing vibration monitor system shall include one or more of the following options:
- a) monitor and display of single channel acceleration or velocity,
- b) monitor and display two channels in either acceleration or velocity,
- c) monitor and display alternate filter or frequency ranges,
- d) monitor and display unfiltered overall vibration (see Note 2 following 7.4.4.1),
- e) monitor and display in true rms,
- f) monitor and display in true peak,
- g) alternate full-scale ranges,
- h) dual voting logic (AND Logic),
- i) OR Logic.
7.4.6 Speed Indicating Tachometer
If specified, a speed indicating tachometer shall be provided. It shall have the ability to record and store the highest measured rotational speed (rpm), known as peak speed. If specified, controlled access reset capability for the peak speed function shall be available both locally and remotely.
7.4.6.3 Tachometer Sensor Types
The system shall accept transducer inputs from either standard probes or magnetic speed sensors.
7.5.2 Outdoor Installations
Outdoor installations shall be designed and located to avoid adverse vibrational and environmental effects.
8 Electronic Over speed Detection System
The vendor of the turbine or other prime mover that has the ability to over speed shall have responsibility for providing the ODS.
9 Surge Detection Systems
The function of the surge detection system shall be to detect surges and provide output for use in minimizing the number of surge cycles.
10 Emergency Shutdown Systems (ESDs)
The function of the ESD is to act as the logic solver that consolidates all shutdown commands to ensure proper timing and sequencing for a safe shutdown.
E.2 Signal Detection Schemes
Two signal detection schemes are used simultaneously in the gearbox casing vibration monitor. They are true peak and true rms.
E.2.5.a Signal Detection Circuitry
The detection circuitry in the monitor shall be consistent with the displayed units. If peak is displayed, a peak circuit detector shall be used in the monitor circuitry. Confusion occurs when an rms detector is used in the monitor and its output is scaled by 1.414 to display as peak units. This conversion is only valid for purely sinusoidal signals, which is rarely the situation except during calibration. An instrument displaying peak as 1.414 × rms may yield significantly lower values than one with a true peak detector when observing the same vibration signal. Many portable instruments use this approach, which can create confusion when comparing readings. To avoid confusion, it is recommended that peak measurements derived from rms be referred to as “derived peak” to distinguish them from “true peak” measurements.
I.1.1 Set point Multiplier Factor
Set point multiplication is the function whereby selected channels in the monitor system have their alarm (alert) and shutdown (danger) set points elevated by some preset amount (usually an integer multiple such as 2 or 3).
I.1.2 Invoking Set point Multiplication (Trip Multiply)
Set point multiplication is usually invoked by an external contact closure (such as a turbine control system relay output). However, this command could also be invoked via a digital communication link on some MPS’s.
I.5.3 Proper Selection of Set point Multipliers
The characteristic response for each measurement location documented in I.5.2 above should also be used to establish the appropriate multiplier. The multiplier should generally be chosen to be as small as possible while still elevating the alarm (alert) and shutdown (danger) set points to levels that are above the machine’s characteristic response at resonance. Provisions for set point multiplication by 2 or 3 are required of MPS’s complying with this standard (the example contained in Figure I.1 assumes an integer multiple of 3 as can be noted by the tic marks on the vertical axis). When multipliers in excess of 3 are required to accommodate the machine’s response at resonance(s), this may be indicative of machinery that has unacceptably large amplification factors. The machinery manufacturer should be consulted.
I.6.4 Manually Invoking Set point Multiplication
This method does not rely on an automatic machinery control system. Instead, an operator manually invokes the set point multiplication in the MPS by a pushbutton or switch or timer as part of the machine start-up or shutdown procedure. However, this is rarely encountered because most machines are now fitted with automatic control systems capable of performing all start-up and shutdown control and sequencing without human intervention.
API670-5th edition Requirements for condition monitoring system
N.1 Condition Monitoring – General
This annex discusses the function and requirements of machinery CMS’s and offers recommendations for monitoring methods, intervals, parameters to be measured and evaluated, and data to be recorded. Caution—the function of a MPS as outlined in the normative sections of this standard shall not be compromised or impeded in any way by the implementation, function, or malfunction of a CMS.
N.2 Condition Monitoring – Scope
While the normative sections of this standard specifically define a MPS, this informative annex is tutorial in nature and suggests common functionality in (and recommended application of) CMS’s. For the purpose of this discussion, a CMS is considered distinct and separate from a MPS. While it is recognized that these systems are frequently installed together and, may even be tightly integrated with one another, irrespective of the architecture, the recommendations offered in this informative annex do not in any way supersede or eliminate the requirements of the normative sections of this standard. The functionality described in this annex may build upon the underlying protection system capabilities, but should be construed as augmenting, rather than relaxing, the requirements specified elsewhere in this standard.
N.3 Data sources
CMS’s may be employed to monitor the health of many types of assets in a plant or enterprise and are not limited to assets already fitted with a MPS. Their function is to detect and identify a fault before it could potentially lead to a shutdown. This may require additional data sources beyond those typically available in a MPS.
- a) Signals from vibration or temperature sensors installed as part of a MPS conforming to this standard.
- b) Signals from additional sensors mounted on machinery fitted with a MPS but that do not provide input to the protection system.
- c) Signals from vibration, temperature, pressure, or other types of sensors mounted on machinery not fitted with a MPS conforming to this standard.
- d) Data passed from process control and automation systems. These data are typically measures of attributes that pertain to the process in which the machine contributes. Examples include flows, gram molecular weight, fluid temperature, suction and discharge pressures, etc. This data is typically valuable because it describes the process conditions acting on and in the machine. It is also valuable for thermodynamic performance calculations that may augment the mechanical and rotordynamic measurements available from the machine.
- e) Manually gathered data such as oil analysis data, additional machinery vibration data, thermographic data, and others.
N.9 Static versus Dynamic Data
When discussing data associated with condition monitoring, a good initial separation is static versus dynamic.
With a radial displacement probe, the static portion can be classified as an overall amplitude or with filtering and a speed reference can be broken into a filtered amplitude and phase, typically 1X, 2X, etc. If the dynamic portion of the data is also captured, additional information can be displayed in the form of time wave forms, orbits, spectrum, and many others. This differentiation is also applicable for velocity probes, accelerometers, load cells, microphones, strain gauges, and dynamic pressure transducers.
N.11 Faults
When diagnosing any fault it is recommended that the analyst ensure that all operating parameters are within the normal ranges. Something as simple as a lube oil supply temperature being out of range can change the oil viscosity and therefore cause a change in the vibration signal. Running machinery at or near a resonance frequency can cause the overall amplitude to increase drastically.
N.11.2 Unbalance
Unbalance occurs on a rotor when there is a heavy spot (see Figure N.6). This can either be caused by the addition of mass (e.g. material build-up on a fan) or by the loss of mass (e.g. tip breaks off of a fan blade). It is characterized by a strong 1X vibration in the radial direction. Because it is a radial force, the amplitude should be roughly equivalent in both the horizontal and vertical directions. If there is a large discrepancy between these values, then there is suspicion of a resonance on the machine as well.
N.11.3 Misalignment
Misalignment occurs when the shaft center lines of two coupled shafts are not collinear. It can consist of an offset misalignment, Figure N.7, as well angular misalignment, Figure N.8. Offset misalignment generates a high 2X peak in the radial direction, Figure N.9, while angular misalignment generates a high 1X peak in the axial direction.
N.11. 4 Looseness
Looseness (see Figure N.10) increases on a machine whenever the clearance tolerances are exceeded (e.g. due either to wear or maladjustment) or when the supports of the machine are loose or damaged (e.g. cracked foot).
N.11.6 Anti friction Bearing
Anti friction bearings, also known as roller element bearings, generate many different fault frequencies because of their complex design.
N.11.12 Gear Defect
Gearboxes are among the noisiest and most complex pieces of equipment to diagnose. Each time that a tooth on one gearwheel mates up with a tooth on the other gearwheel, it generates an impact. Given the large number of teeth on gearwheels, there can be hundreds of impacts occurring in a single shaft rotation—especially on a multistage gearbox such as the one shown below. The “gear mesh (GM)” frequency is equal to the turning speed of a shaft multiplied by the number of teeth on the gear wheel attached to that shaft. Vibration measurements will normally have high amplitude, so it is necessary to look in the spectrum (or waveform) for specific information about the nature of the vibration in order to diagnose a gear fault. The high peaks in the spectrum shown below are the 1X and 2X of the gear mesh frequency
N.12 Fluid-induced Instabilities
Fluid-induced instabilities are caused by fluid forces acting on the rotor and can result in undesirable (often destructive) levels of vibration. Fluids may be liquids or gases. Typical source locations of fluid-induced instabilities are within the support bearings or seals. Oil lubricated bearings are designed as a hydrodynamic bearing. It forms a hydrodynamic wedge of oil that lubricates the surfaces and supports the weight of the rotor. The rotation of the rotor causes circumferential rotation of the oil within the bearing. Two boundary conditions exist. The oil wedge surface that is in contact with the shaft surface has an angular velocity equal to rotor speed. The oil wedge (see Figure N.24) surface that is in contact with the bearing surface has an angular velocity equal to zero. Therefore, the average circumferential velocity of the oil is 50 % of rotor speed. Because of viscous friction and shearing effects, the actual average circumferential velocity of the oil is less than 50 % of rotor speed (typically 35 % to 48 %). The fluid forces of the oil acting on the rotor can be categorized as two fundamental forces: a fluid film radial force and a tangential fluid film force due to rotation and circumferential velocity. A
N.12.4 Resonance
All structures, including machinery, machine components, piping, and foundations have a series of natural (resonant) frequencies. The resonant frequency(s) of a rotor system is determined by the rotor mass (M) and the stiffness.
N.13.2.3 Spectra Sampling
N.13.2.3 Spectra sampling requirements are as follows.
- a) Resolution—The resolution of the spectrum increases with the number of spectral lines used. This means the more spectral lines, the more information the spectrum contains. However, if more spectral lines are used, it takes longer to measure and more memory is used to store the spectrum. High resolution measurements are appropriate for applications when it is necessary to distinguish between two closely spaced vibration frequencies
(i.e. motor slip frequencies) or when the Fmax is very large. For coast-up, coast down recordings, a setting of 400 spectral lines is typically adequate. Additionally, a minimum of 800 spectral lines or higher is recommended for spectra measurements.
- b) Frequency Range (Fmax)—Fmax is the maximum frequency displayed on the spectrum. Or more specifically the frequency range, starting from zero, over which vibration amplitudes are displayed. In general, the higher the operating speed of a machine, the higher the Fmax needs to be to capture all crucial information.
- c) Runout compensation for synchronously sampled data should be provided.
- d) Fmax for proximity probes is typically set at 5 to 10 times shaft speed to provide good resolution of data for detection of common shaft related problems like unbalance, misalignment, excessive bearing clearance, oil whirl, oil whip, etc. In certain cases, it may be useful to display higher orders to detect high frequency phenomena like high-energy vane passage frequency in a pump or gear mesh frequencies in a gear unit.
N.13.2.5 Hanning Window
Waveform data is processed by FFT to create a spectral plot. To prevent the spectral lines from bleeding into each other, the data is usually modified by a Hanning window function.
N.13.2.6 Anti-aliasing Filters
Aliasing is an effect that results in erroneous measurements when the frequency of the signal being sampled is more than 0.5 times the sampling rate. An anti-aliasing filter is recommended to eliminate these errors except in situations where the presence of an anti-alias filter would produce significant phase distortion at the frequencies of interest.
N.13.2.13 Sample Rate
For standard vibration measurements, the sample rate is automatically determined through the selection of the frequency range and the resolution.
N.13.2.14 Peak Impact Detection
Gearbox and rolling element bearing faults generate characteristic impact signals that are frequently not visible in a typical FFT measurement. Instead of using a typical FFT measurement, other parameters such as enveloping may be used to analyze the fault.
N.14.1 Waveform Sampling Types
The system should be capable of both synchronous and asynchronous sampling.
N.14.2 Synchronous Sampling
Synchronous sampling should have the following:
- a) at least 100 sample points per revolution at full speed;
- b) at least 8 revolution sample length;
- c) no anti-aliasing filters;
- d) X and Y probes simultaneously sampled with phase reference;
- e) option to time synchronous average waveforms with at least 16 averages unless system does not need averaging;
- f) band-pass filtering available for 1/2X, 1X, 2X, and 3X shaft speed and low-pass filtering with corners available for
1X, 2X, and 3X shaft speed. Caution should be taken to ensure no unwanted phase shifting of the data, as shifting can be caused by filters;
- g) full spectrum plots presenting forward and reverse components are valuable, this presents orbit shape and component relationship in the frequency domain.
N.16.2.a Cursor
Cursor readout ability for all plots
N.16.2.b Manual and Auto Plot Scaling
Manual and auto scaling for all plots
N.16.4 Alarm Capabilities Recommendations
While it is not necessary to alarm in the machinery protection system on every value measured, it is often desirable to alarm on such measurement in the CMS. The alarms in the CMS and resulting actions desired should be considered and documented prior to installation. In most cases the vendor, vendor’s representative, machine OEM, the facility or corporate predictive maintenance personnel, or other knowledgeable persons with respect to machinery monitoring techniques and the selected monitoring system should be consulted to assist in the proper definition of the alarms.
N.16.4.3 Frequency Domain Analysis
The following minimum frequency domain plotting capabilities should be provided:
- a) frequency spectra in which linear amplitudes, accelerations, velocities, or displacements are plotted versus linear frequency expressed as cycles per second (Hz), cpm, or orders;
- b) waterfall plots with at least 50 spectra plotted versus time;
- c) cascade plots with at least 50 spectra plotted versus speed.
N.16.4.4 Time Waveform Analysis
The following minimum time domain plotting capabilities should be provided:
- a) time waveform plots of unfiltered data;
- b) time waveform plots of time synchronous averaged data;
- c) orbit plots of unfiltered data;
- d) orbit plots of synchronous (1X, 2X) or running speed data;
- e) time synchronous averaged orbit plots;
- f) runout compensation capabilities for synchronously sampled data (i.e. slow-roll compensation, thermal bow, etc.).
N.16.4.5 Critical Speed Analysis
When monitoring turbo machinery operating above the machine’s first critical speed the following minimum transient data plotting capabilities should be provided:
- a) Bode plot for speed-transient data;
- b) polar plots for speed-transient data;
- c) shaft centerline plots, polar plot of shaft centerline position within bearing;
- d) gap voltage plots.
N.16.4.6 Trend Analysis
The system should be able to display any measured parameter as a function of time in a Cartesian plot.
N.17 Data Storage
N.17.1 Basic Data Storage for Normal Operation
For an online system, data being monitored should be captured and stored on an exception basis, for example whenever an alarm condition occurs or when the parameter value changes by more than a pre-defined amount. There should also be an option to store data on a time basis, for example, once per hour, once per day, once per week. Stored data should be retained in the database for at least 24 months.
N.17.3 Data Storage for Start-up/Coast down
When monitoring turbo machinery operating above the machine’s first critical speed the system should collect and store the vibration-related data as specified in N.19.3 on coast down and start-up at a rate of every 50 rpm or less. Additionally, one set of data, as specified in N.19.4.4 should be obtained once the machine has reached operating speed.
N.17.4 Data Storage for Known Machine Problem
The system should provide the capability to change the interval for the data collected in N.19.3 and N.19.4.4 for startup or troubled machine monitoring.
N.17.5.2 Static Values Storage
It is recommended that monitoring of static values such as overall vibration, DC gap voltage, thrust, and temperature should be at least once per second. Storage should be both by exception and on a user-defined time basis.
N.17.5.3 Dynamic Data Storage
Dynamic data such as waveform and spectral data for long-term condition monitoring and maintenance planning should be monitored at least once per hour. Storage of waveform and spectral data should be possible both on exception and on a time basis. In addition the system should be capable of performing analysis on the waveform and spectrum such as energy in a frequency range, nX energy, nonsynchronous energy, waveform shape analysis, relative synchronous harmonics for the purpose of automatic analysis of user specified analysis types and automatic alarming on these analysis types. Dynamic data collection configuration should be capable of being tailored for process conditions. That is, analysis should be adaptable depending on machine speed, or other events.
N.17.5.5 Continuous Display of Dynamic Signals
Online systems should be capable of live or near real-time mode, displaying the following plots with typical refresh rate of at least once per second at 3000 rpm and above. Live mode shall not impact normal data collection, data storage, or transient data capture. The plots are as follows:
- a) waveform,
- b) spectrum,
- c) orbit,
- d) shaft centerline,
- e) cascade,
- f) waterfall,
- g) Nyquist,
- h) Bode
N.17.5.7 Live Mode Data Storage and Printing
The system should be capable of printing the display on demand or saving the display data to disk.
N.17.6 Remote Access
Remote access can mean different things to different people and as such needs to be clarified for all parties to have a full understanding.
N.19.7 Enhanced Monitoring of Troubled Machines
If unusual vibration or a trend in vibration, thrust position, or bearing temperature is detected, an enhanced monitoring program should be implemented until the problem is corrected or the machine is shut down. The enhanced monitoring program should include, as applicable, additional instrumentation (tape recorders, oscilloscopes, spectrum analyzers, etc.) and continuous or intermittent attendance by qualified analysis personnel. The interval of the monitoring and data storage should be based on the severity, rate of change, and the result of the analysis and diagnostics.
N.20 Alarm Settings
A fundamental difference between a CMS and a MPS is the intent and application of alarms. MPSs monitor critical parameters that indicate the gross condition of the machine, typically balance. Its alarms are intended to annunciate a severe problem that, if left unattended, could result in damage to, or failure of the machine. The intent of a CMS’s alarms is to signal the presence, severity and/or propagation of specific faults and operating conditions. CMSs will usually monitor the same parameters that a MPS does but will also monitor many additional parameters that may indicate the presence of a fault or a condition that could promote the development of faults, and/or they may signal degraded machine performance.
N.21.2 Data Types for Analysis
Data collected for analysis should include the following:
- a) routine steady state data,
- b) data collected based on an alarm condition,
- c) data collected during transient conditions.
N.24 Calibration and System Verification
Calibration and system verification should be performed per the manufacturer’s recommendations and/or the plant maintenance program. Consideration of the performance of the sensor (e.g. bias current and trend of line frequency components, either 50 Hz or 60 Hz) may be used in determining calibration.